Sponsored by M.D.,
Ph.D. Kutushov. Israel
Conducted by:
HPBM
Harlan Pharmacological & Biological
Monitoring Kiryat Weizmann, Rehovot, Israel
Anti Proliferation Test
The effect of Kutushov‘s compounds
on proliferation rates of HFF and
A357 cell-lines
Study number: Idealiza - Q-103-03 - PRO
(Non-GLP)
April 2003
Sigalit Leibovitch, Ph.D.
Hagar Greif, Ph.D
Table of Contents
1 Preface
2 Executive
3 Introduction to the assay
4 Materials
5 Methods
6 Results
7 Results summary
1 Preface
During April 2003, HPBM performed In Vitro various compounds, supplied by Idealiza.
HPBM experimental program examined the effect of the compounds on proliferation rate of HFF and A357 cell-lines using Thymidine incorporation study.
HPBM experimental program was conducted according to the experimental design that was agreed by the Sponsor.
2 Executive Summary
2.1 Compounds number 1 and 2 indicated a trend of anti-proliferation activity in the tested concentrations as compared to the controls.
2.2 Compounds number 3 and 4 did not significantly affected proliferation rate in the tested concentrations, compared to the controls.
2.3 No significant difference was found between HFF and A375 proliferation rates in each tested compound.
3 Introduction to the assay
As cells grow in culture, they divide and intrinsic characterizations and response to various environmental signals. In order to evaluate proliferation rate 3H-thymidine uptake into cells measured. The radioactive thyimidine is incorporated to the DNA that newly formed. The higher the proliferative response, the higher number of counts in the respective culture will be.
If 3H-thymidine uptake is not detected, we can only assume that cells do not proliferate. Cells may be viable but arrest in a certain phase of the cell cycle. To differentiate between the two possibilities, a metabolic activity measurement should be performed (i.e Alamar blue™ assay).
In culture, the cell cycle distribution is normal. Thus, in a certain moment various cells may be found in different cell-cycle phases. This may cause variability in results due to dissimilar thyimidine uptake by the cells in each culture. Therefore, standard deviation (SD) in this assay is high. In order to decrease variations, 3H-Thymidine was present for a period of 48 hours enabling cells to complete at least one cell-cycle.
The normal cells chosen for this test were HFF (human forskin fibroblast). Being similar to embryonic cells, HFF proliferation rate is high as the transformed cells A375 (human malignant melanoma). However, HFF proliferation rate does not reflect normal cell proliferation rates which are relatively low particularly after differentiation processes. HFF are utilized only since they enable us to culture normal cells in-vitro. Despite their similarity to malignant cells in their proliferation rate, HFF represent normal cells at the molecular level within the cells.
4 Materials
4.1 Test compounds
Tested substances (1-4) were supplied by the sponsor and dissolved to
104M in RPMI1640 medium. Compounds were added in a 1:10 dilution to the wells to obtain 10-5M, 10-7M and 10-9M, the tested final concentrations.
4.2 Controls
Positive control – Doxorubicin, in the aboved indicated concentrations. Negative control – Medium
4.3 Buffers
Washing buffer: PBS + 0.01% Triton X100.
Lysis buffer: 50mM Tris-HCl ph=8, 150mM NaCl, 1% Np-40, 2mM EDTA.
4.4 Cell lines
HFF (human forskin fibroblast) cells were grown in DMEM high glucose medium, supplemented with 10% FBS, 2mM L-glutamine,1% Penicilline/streptomycin, 1% non essential amino acid and 0.26% Sodium bicarbonate.
A375 (human malignant melanoma) cells were grown in RPMI1640 medium, supplemented with 10% FBS, 2mM L-glutamine, 1%Penicilline/streptomycin and 1% non essential amino acid.
5 Methods
5.1 Cells proliferation assay:
HFF and A375 were grown in in 75 cm2 culture flasks. The culture medium was changed every other day and the day before the experiment. For Subculture, the medium was removed and the cells were detached from the culture flasks with 0.25% trypsin–EDTA. Culture medium with fetal bovine serum was added to stop trypsinization. The cultures were kept at 37°C in an atmosphere of 5% CO2 and 100% humidity.
Cells were diluted at a density of 5,000 cells/well in 96 well microscintilation plate (Packard). Culture was in the logarithmic phase at the whole time of the experiment.
A day after seeding cells, 1-4 substances were added to the plates to 10-5M, 10-7M and 10-9M concentrations. Each plate column (8 wells) was used to test one substance in one concentration.
Two days later, for each well in the culture plate 3[H]-Thymidine (NET-027
Thymidine[methyl-3H] from NEN, 6.7Ci/mmol) was added to final concentration of 0.4 uCi/well. Plates were returned to the incubator for 48 hours and than harvested.
5.2 Cells harvesting
Medium was collected and cells were washed twice with PBS containing 0.01% TritonX100. Cells were lysed with 20µl Lysis Buffer per well for 30 minutes with shaking. Radioactivity was determined after an addition of 180µl Scintillation liquid (Microscint 20TM, Packard).
5.3 Data calculation:
Data represent the mean amount of Thymidine counted per well (CPM). Average and standard deviation (SD) were calculated for each plate column (8 wells). In order to compare between HFF and A375 cells, the average of negative control
(medium) column of either HFF or A375 was presented as 100% and all other tested concentrations were respectively translated.
6 Results
6.1 Anti-proliferation effect of compound no 1:
Figure 1: Effect of compound number 1 on HFF and A357 cells
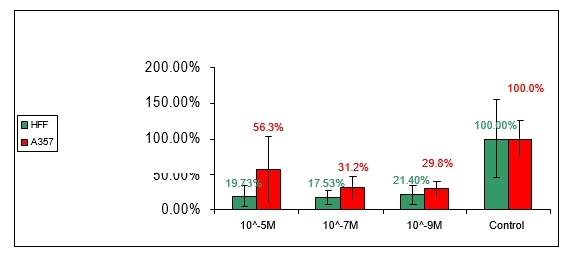
As can be seen in figure 1 compound number 1 has anti-proliferative effect on both HFF and A375 cells in 10-5M, 10-7M and 10-9M tested concentrations. No significant difference can be seen between HFF and A375 cell-lines.
Anti-proliferation effect of compound no 2:
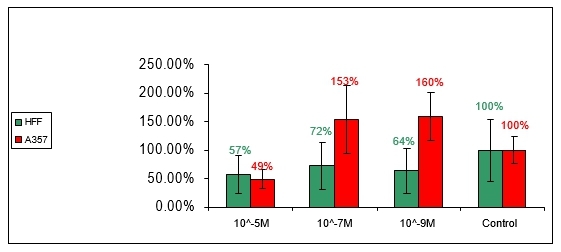
Figure 2: Effect of compound number 2 on HFF and A357 cells

In figure 2 compound number 2 shows evidence of dose-response effect. In concentrations of 10-5M and 10-7M low rates of proliferation were measured for HFF and A375 cells while, concentrations of 10-9M were not significantly different from the control group. Compound number 2, like compound number 1, did not influence selectively the proliferation level of either one of the cell-lines.
6.2 Anti-proliferation effect of compound no 3:
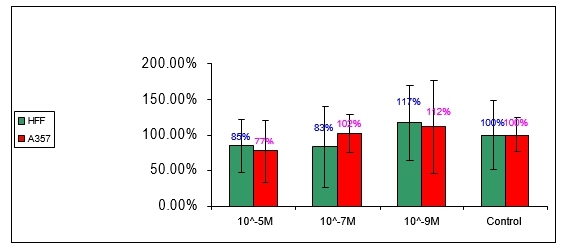
Figure 3: Effect of compound number 3 on HFF and A357 cells
Compound number 3 shows an indication of anti-proliferative effect in 10-5M concentration for both HFF and A375 cells. This effect does not seem to be statisticaly significantly from the controls, considering the SD values. No significant difference could be detected in 10-7M and 10-9M concentration, comparing to the controls in HFF and A375 cells.
6.3 Anti-proliferation effect of compound no 4:
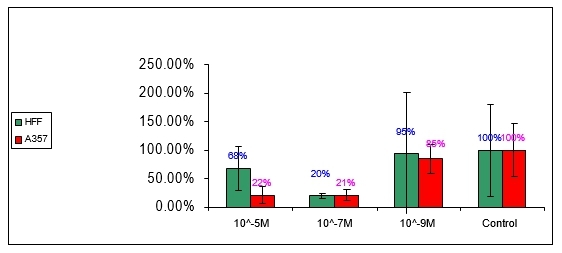
Figure 4: Effect of compound number 4 on HFF and A357 cells
Compound number 4 has no effect on the proliferation-rate of neither on HFF nor A375 in the indicated tested concentrations.
6.4 Anti-proliferation effect of Doxorubicin:
Figure 5: Effect of Doxorubicin on HFF and A357 cells
Doxorubicin was used in this test as a positive control for anti-proliferation activity. From the literature it is known that the LD50 of Doxorubicin for HFF and A375 cells is in 10-8M concentration.
As figure 5 demonstrates an anti-proliferation activity was measured in 10-5M and 10-7M concentration of HFF and A375 cells. In 10-9M the proliferation rate was similar to the controls of HFF and A375. The pattern of the dose-response that was displayed by the Doxorubicin was similar to the one revealed by compound number 2. Doxorubicin affected HFF and A375 at the same extent in all tested concentrations.
7 Results Summary
The results above summarizes one test that screened 4 unknown com pounds for anti proliferation activity. Therefore, no calculations may be drown.
The anti-proliferation effect of the compounds was tested on normal cells ( HFF cells) compared to carcinoma cells (A375 cells).
We suggest two main indications from this test:
a. None of the compounds found to inhibit selectively A375 proliferation rate.
b. Compound number 1 and 2 may contain anti-proliferation activity in the tested concentrations, while compounds number 3 and 4 did show no significant effect on the proliferation rate.
Sponsored by M.D.,
Ph.D. Kutushov. Israel
Conducted by:
HPBM
Harlan Pharmacological & Biological
Monitoring Kiryat Weizmann, Rehovot, Israel
Compounds A-F
Anti-Proliferation and Anti-Viability
In Vitro Assays in MCF-7 and A375Cell-lines
Q-334-05
Experimental Report
(Non-GLP)
August 2005
Sigalit Leibovitch, Ph.D.
Hagar Greif, Ph.D., Head of R&D
Index
1 Executive summary.
2 Introduction.
3 Materials
4 Methods
6 Summary
7 Appendix 1 – AlamarBlueTM Signal (Short-Term Assay)
8 Appendix 2 – Thymidine Incorporation (Long-Term Assay)
List of Figures
Figure1 The effect of compounds A-F on the metabolic rate of MCF-7 cells.
Figure2 The effect of compounds A-F on the metabolic rate of A375 cells.
Figure 3 Anti proliferative effect of A-F compounds in MCF-7 and A375 cells
List of Tables
Table1 Activities Summary of effect of 1nM Compounds A-F on MCF-7 and A375 cells.
Executive summary
Study Objectives
- To evaluate the anti-proliferative and cytotoxic effect of A-F compounds in MCF-7 and A375 cell-lines.
Main findings
- Compounds A-F at concentration of 1nM do not affect the metabolic rate of MCF-7 or A375 cancer cells.
- Compounds B and D has anti-proliferative effects, on MCF-7 or A375 cells.
- Compounds C and F has anti-proliferative effect only on MCF-7 cancer cells.
- Compounds A and E do not affect cell proliferation of MCF-7 or A375 cells.
Introduction
The alamarBlueTM assay is designed to measure quantitatively the viability of various human and animal cell lines, bacteria and fungi. The bioassay is also used to establish relative cytotoxicity of agents within various chemical classes[1], thus utilized to predict cytotoxic or necrotic effects of medical devices or materials.
The alamarBlueTM is a growth indicator that exhibits colorimetric change in the appropriate oxidation-reduction range relating to cellular metabolic reduction. It is also minimally toxic to living cells and has a clear, stable distinct change, which is easy to interpret. As cells grow and uptake alamarBlueTM, their innate metabolic activity results in its chemical reduction. In its reduced form, alamarBlueTM displays pink fluorescent color, in contrast to being blue and non-fluorescent in its oxidized state.
One of the characteristics of a tumor cell is its ability to proliferate (multiply) endlessly. To determine this proliferation, a radioactive-labeled-DNA base (3H-thymidine) is added to the culture medium and is incorporated in the DNA proportionally to proliferative activity. The higher the proliferative response the higher the radioactive counts in the cell's culture. 3H-thymidine incorporation assay is considered to be the most sensitive method for cell proliferation. However, the ability to detect a minimum number of proliferating cells in a certain sample depends on the amount of 3H-thymidine incorporated into the cells and thus on the labeling period. Hence, as long as 3H-thymidine is present in the medium and DNA is synthesized new cells are labeled. In most cases, detection requires a labeling period of 2 to 24 h, in which one cycle of DNA synthesis in all the cells is achieved.
The assays that are described above discriminate between two basic activities of the cell – its viability and its proliferation ability. In order to assess the efficacy of therapeutic agents such as antibiotics and anti-cancer agents, the drug developer should employ them both.
Materials
1.1 Test items
The Sponsor supplied six compounds labeled A to F as dry powders. Prior to the assay all compounds were dissolved in DMSO to 1mg/ml concentration (accept D that was dissolved in PBS). Compounds were diluted with medium to final concentration of 10-9M in eight repeats for each assay.1.2 Reagents
[3H]-Thymidine, Amersham Pharmacia, Cat. No. TRK63740-60 Ci/mmol, 1mCi/ml.
Alamar blueTM Serotec, Cat. No. BUG012B.
1.3 Controls
Doxorubicin (Sigma, Cat No. 44583) and Digoxin (Sigma, Cat No. D-6003) were used at final concentration of 10-5M and 3*10-5M, respectively for Viability and cell proliferation assays.
Since most of compounds were dissolved in DMSO and further diluted in medium, a vehicle control group, containing final concentration of 0.001% DMSO was included.
1.4 Cell lines
MCF-7, originated from human breast cancer, was provided by ATCC (American Type Culture Collection) at passage unknown.
A375 originated from human malignant melanoma cancer, was provided by ATCC (American Type Culture Collection) at passage unknown.
1.5 Growth Media
MCF-7 were grown in DMEM medium supplemented with 10% Fetal Bovine Serum 1% penicillin-streptomycin and 1% L-glutamine.
A375 cells were grown in RPMI1640 medium, supplemented with 10% FBS, 2mM L-glutamine, 1%Penicilline/streptomycin and 1% non essential amino acid.
Methods
1.6 Cell Culture
The MCF-7 and A375 cells each were cultured in 25cm2 culture flasks. The flasks were kept at 37°C in an atmosphere of 5% CO2 and 100% humidity. The culture medium was changed every other day. For subculturing, the medium was removed and the cells were detached from the culture flasks with 0.25% Trypsin–EDTA. Culture medium with fetal bovine serum (FBS) was added to stop trypsinization.
Each cell line was seeded at a density of 5,000 cells per well in a 96-optical well plates.
1.7 Short-term assay – Alamar blue
24 hours following exposure of cells to the compounds medium is removed and Alamar blue was added in fresh medium. The fluorescent signal (Excitation 544nm/Emission 590nm) was counted after additional incubation for 6 hours at 370C.
1.8 Long-term assay – Thymidine incorporation assay
After a day of incubation with the tested compounds, 3H-Thymidine was added to final concentration of 0.4μCi/well. Plates were returned to the incubator for additional 48 hours. Then, medium was removed and cells were freezed at -200C. Cells were incubated with 5% TCA at 4oC for 20 minutes. Lysis was achieved by the addition of 10M NaOH solution and lysis buffer for 30 minutes with shaking. Radioactivity was determined after addition of 300μl scintillation liquid (MicroScint 20TM, Packard)
Results
1.9 Short-Term Metabolic Rate Effect
The assay was performed as described in Methods. Briefly, the cells were seeded (5000/well) and the day after controls (10-5M) and the tested compounds (10-9M) were added. Following 24 hours of incubation with the compounds, AlamarBlue was added and its fluorescence was measured.
Figure 1 The effect of compounds A-F on the metabolic rate of MCF-7 cells.
MCF-7 cells were treated with 1nM compounds, 10μM Doxorubicin and 30μM positive controls and vehicle control (Medium+DMSO) for one day. Results were expressed as % of vehicle control Mean value ±SD. Alamar blue fluorescent signal was measured at excitation/emission 544nm/590nm. Raw data is presented in Appendix 1.
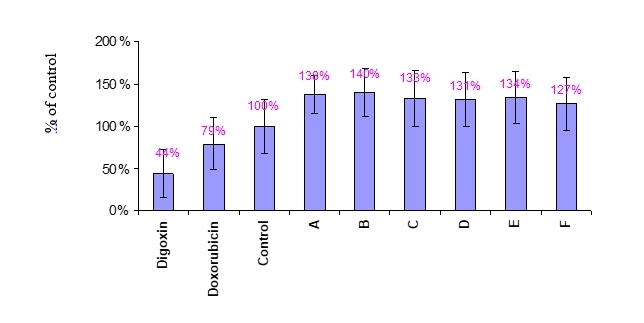
Figure 2 The effect of compounds A-F on the metabolic rate of A375 cells.
A375 cells were treated with 1nM compounds, 10μM Doxorubicin and 30μM positive controls and vehicle control (Medium+DMSO) for one day. Results were expressed as % of vehicle control Mean value ±SD. Alamar blue fluorescent signal was measured at excitation/emission 544nm/590nm. Raw data is presented in Appendix 1.
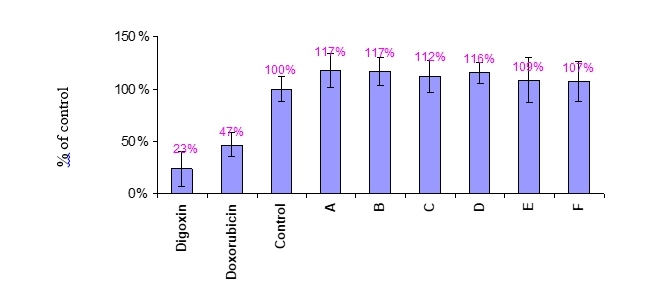
As can be seen, the metabolic rate of MCF-7 (Figures 1) and A375 (Figure 2) cells was significantly decreased following treatments with the positive controls Doxorubicin and Digoxin. The tested compounds A to F did not affect the metabolic rate of either MCF-7 or A375 as compared to the control (vehicle control, expressed in the graph as 100%).
Thus, A-F compound in the concentration of 1nM do not affect MCF-7 or A375 cells viability.
1.10 Long-Term Anti-Proliferative Effect
The long-term assay detects DNA synthesis, a marker for cell proliferation, by using radiolabeled Thymidine. The results of the long-term assay are depicted below.
Figure 3 Anti proliferative effect of A-F compounds in MCF-7 and A375 cells
MCF-7 (A) and A375 (B) cells were treated with 1nM compounds A-F, positive controls (10μM Doxorubicin and 30μM Digoxin), and vehicle control (Medium+DMSO) for 3 days. Incorporation of 3H-Thymidine to proliferating cells is presented as % of vehicle control Mean value ±SD. CPM Raw data is presented in Appendix 2.
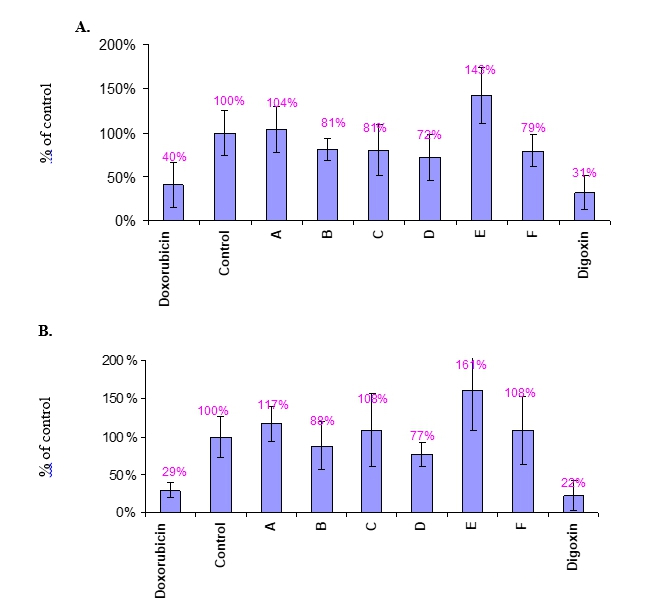
As depicted in Figure 3, treatments with Doxorubicin and Digoxin (positive controls) resulted significant decreases in cell proliferation of MCF-7 (Figure 3A) and A375 (Figure 3B) cells, as compared to the negative control.
Compound A (1nM) did not affect cell proliferation of MCF-7 and A375 cells. Compound B (1nM) inhibited by ~20% and ~10% the proliferation of MCF-7 and A375 cells, respectively.
Compound C and compound F had 20% anti-proliferative effect on MCF-7 cells but did not affect proliferation of A375 cells.
Compound D has the highest proliferation inhibition effect on both cell-lines (28% in MCF-7 and 23% in A375 cells).
Compound E had positive proliferative effect on both cell-lines (around 150%) as compared to the control of each cell-line.
To summarize, compounds D had the major anti-proliferative activity (about 20%) in both MCF-7 and A375 cells. Other compounds were less potent for both cell lines.
Summary
The utilization of two different assays, one that measures metabolism and the other that measures proliferation, allows us the discrimination between A-F compounds activities on MCF-7 and A375 cancer cells. These activities are summarized in Table 1.
Table 1 Summary of Compounds A-F Activities on MCF-7 and A375 cells.
Summary of the results described above. + indicates activity, – indicates non-active.
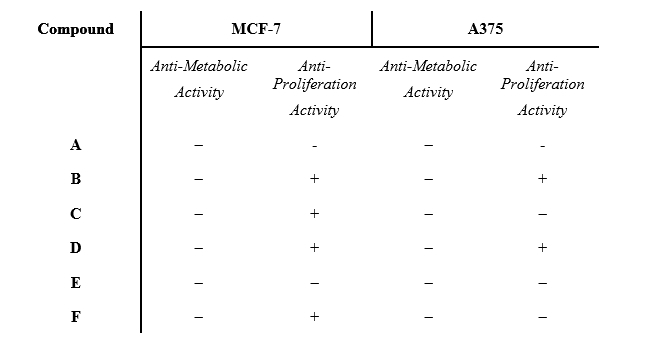
The results above suggest that for MCF-7 and A375 cells,
- Compounds A-F at 1nM concentrations do not affect cell viability in both cell lines.
- Compounds B and D at 1nM concentrations has anti-proliferative effects, on both cell-lines.
- Compounds A and E at 1nM concentrations do not inhibit cell proliferation of both cell-lines.
- Compounds C and F has anti-proliferative effect only on MCF-7 cells.
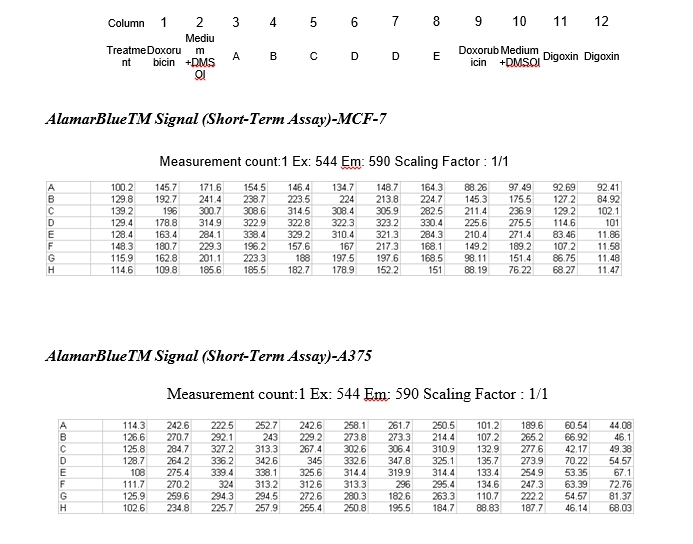
Appendix 1
Plan plate cultured with either MCF-7 cells or A375 cells.
Appendix 2

Читать полностью